Oil from all plastics, coal from garbage, ethanol ?
BRAVO!!! now onto our local waste mountain-maker, namely Rumpke's and their current repugnant abuse of our local county's (Brown County's) citizen's right to have a future with a simple task of sorting your trash WHEN YOU PUT YOUR STUFF TO BE DISPOSED OF INTO THE RIGHT separate CAN/BAG.....
Every bit of paper is already going in its own collecting bag, right!!!
and metal DITTO, in its own bag, right!!!
then it's only 2 more bags, one for ALL PLASTICS...
and the other for compostables to go into the composting BIN, with the household grease and pet excreta.. or (if you live in an apartment or don't do gardening) to bag for pickup!
And if we can defeat the Health Department (the traitors) with their evil ideas on sewage, we can have sustainably low tech composting toilets and be free to put them into service without the ungodly expense of blackwater mounds, ever again. Just use a GREYWATER CONSTRUCTED WETLANDS to get your own natural habitat benefits instead of the 'health' department's TOXIC septic tanks leaking.
And even in the city, the sewers would be hugely less trouble if households were greywater. And you can (with already existing systems) in the city and burbs, just convert the water toilets to bidets for improved hygiene, and add a simple composting lou (buckets if you're inclined like Joe Jenkins system), and it's LEGAL.. you'd even save on your water and sewer bill !
Here's the BRAVO news from FuelFix and Waste Management's creative genius CEO David Steiner:
Fuel Fix » Houston waste company turning trash into treasure
Posted on December 31, 2012 by EJ Grace LLC
A new plant in Oregon could help transform the waste industry with a remarkable new technology: Garbage goes in, oil comes out.
The business objective is to create new energy products out of waste and perhaps eventually eliminate the need for trash storage in landfills altogether, Waste Management CEO David Steiner said. Waste Management’s also investing in such technology as replacing coal with pellets made from garbage and converting trash into ethanol.
The company determined it could earn up to $15 billion a year if it could efficiently separate and resell the nearly 100 million tons of garbage it collects annually.
Waste Management licenses the plastics-to-oil technology, which it will put to work at the pilot plant in Portland, Ore.
Although the plant could utilize plastics taken out of everything from shrink wrap to yogurt containers, it will rely mainly on discarded material from local manufacturing plants, mostly wrap, sheeting and hard plastics like those found in toys.
Plastic is made largely from petroleum. By recovering that petroleum, the Portland plant is projected to produce about 75,000 barrels of oil a year. That is 29 times the rate of the average oil-producing well in Texas, according to the Railroad Commission of Texas.
[EACH such plant is equivalent to nearly 30 oil wells!!]
Substitute for coal
The company also owns the process for transforming garbage into pellets that could be used as a substitute for coal. Waste Management has a plant for the so-called SPEC fuel pellets in San Antonio and is building another plant in Philadelphia.
Caesar said the pellets can be burned by coal plants with a fraction of the emissions generated by coal.
Most waste companies have shied away from investing in conversion technology, instead focusing their cash on operational changes to cut costs and boost earnings, said analyst Barbara Noverini of the investment research firm Morningstar.
[Like Rumpke in our county!
We should give all these "most waste companies" with their lazy cowardly unimaginative CEOs a hint that they can either get an oil producing license themselves or we'll cancel their contract!
Dig into your own county's relationships.
Rumpke has a seat on the Board of Health and pays 'tipping fees' to the County Commissioners, officially, so the Health Department intercepts complaints (only one issued despite 6 years of agitating and evidence galore).
Meanwhile the OEPA conveniently closes its eyes and we pay the price for oil and electric when we could have better instead of the stinking, polluting, growing mountain as Rumpke imports massive amounts of waste from other counties who don't want the stuff either in their backyard. Time for a change.]
Sunday, February 17, 2013
Sunspot Mystery - Climate CO2 Swindle Replaced
The video that started our trek...
Wonderful BrasscheckTV recently previewed a video (The Great Global Warming Swindle) that was intended to destroy the AlGore(et al) idea that CO2 as generated by humans, or any other way, was driving the climate instability. The majority of the effort in the video's script was in showing the weakness in that religiously held idea of CO2 and climate warming were intimately intertwined. The data correlation was less than we have been led to believe and on the usually vociferous 'other side' of the argument, the opposition has been biased in their equally political ideology. Fortunately, a few in the meterology and astronomy type areas were nevertheless struggling in spite of both of them, with causation, and trying to ignore both political-religions.
Finally a pair of Israelis -- Prof Nair Shaveev, (cosmic radiation history) and Prof Yan Veitzer (cloud formation) -- did comparison of sunspot data and planet temperature data, finding over millions of years that when cosmic rays went up, temperature went down, mirror image, perfect correlation quality.. but of course, those time periods for their data points were massive time intervals, century size or more, not even close to decades, much less yearly.
So began the quest to understand the mechanism and to refine the time intervals to see if the relationship held in the closer time-view. Major work was done by the Danes -- their Meterology Institute and their Space Center -- to bring the picture into closer focus, though still planetary in their thinking. A few brave souls have picked up the banner and have attempted to make headway for their now-blossoming theory which is an amazing construct in itself.
The Theory
Sunspots are electromagnetic storms and send out a solar electromagnetic wind that reaches out into space, disturbing earth how? Well, the normal background cosmic radiation (from novi all over in space) interacting with water vapor over the seas, produces clouds which exert cooling to counteract the sun's direct heating. That's the place where sunspot impacts earth weather. Solar activity generates solar wind that deflects the cloud-forming cosmic radiation so that solar warmth reaches the earth and seas in abundance unlike under cloud cover of whatever depth....
At that point the video leaves any further progress undisclosed... Leaving the viewer to wonder about that finer focus, maybe down to daily? ...and what about down to that viewer's own weather, not some fictionally-constructed 'planetary' temperature. Your own temperature, this week or this month or even today?
The Miracle Trek
What I wanted was some idea of how close was the relationship between sunspot frequency and local weather, as we experience it, namely heating need, cooling need and precipitation.. would there be anything in our local data to confirm the idea that weather is just a figment of the sunspot influence on planetary atmosphere..? Would it show up in daily life, in daily weather, in our location?
Well I took a gamble, got the daily sunspot data for 2012 from the Belgian space group as well as the 250 year avg of sunspot peaks to use for judging normalcy of sunspots in daily data...
...and gathered tons of weather data from the nearby Lunken Airport's database of Cinci temperatures and rainfall... daily for the entire year 2012...
...calculated HDDs and CDDs (heating and cooling degree days)... then dug out the 30year avg monthly weather data as a normalizing base (a day that was 100% would then mean just normal average temp or normal average rain)...
---did the 30day rolling averages to get smooth data that would match the 30year avgs that were stored in monthly-type data so that the lagging-30day avg at each point would be normalizable by the calendar month avg, producing a rolling normalized 30 day data-point at each day as the daily data rolled along on the graph for sunspots... and that normalized 30day avg did stand then ready for comparison with the daily sunspot data.. maybe there'd be a lag or not or nothing show up at all.. or whatever...
Then we plotted it and were SHOCKED to see how completely it CONFIRMED that there's an undeniably, *astoundingly strong* relationship between sunspots, rainclouds and heat/cooling degree data.. 365 days of in-synch movement, see for yourself in the attachment of the glorious graph.. We about fell off our chairs...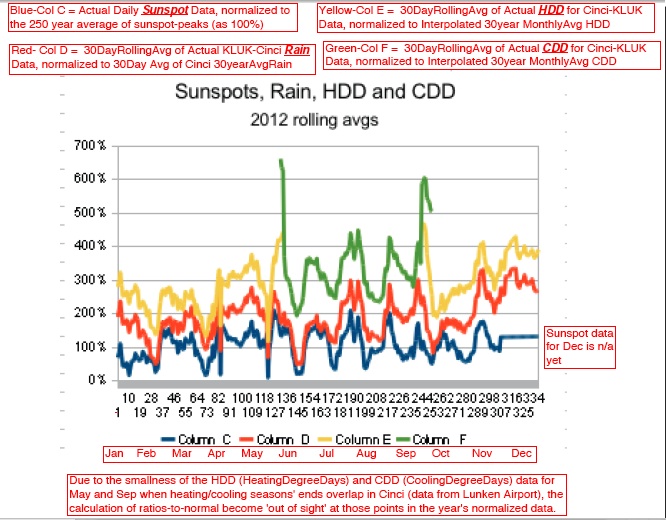 [The blue is sunspot data, red is rain/cloud data, yellow is heating degree day data, and green is cooling degree data in amazing choreography ] In case the graph does not show well in your browser at this blog-page, I've posted it at CIGHE
CO2 is just a symptom... sunspots rule...
But wait, it's not just the in-synch-ness that is CO2-driver-myth-destroying...
The nighttime cloud deep space twist
Many in the myth-imbiber side will just wave that this insynch-ness is not surprising but in analysing their hand-waving ideas, it becomes clear that they were not digesting the idea that the blue line on the graphs is SUNSPOTS, NOT INSOLATION as was what they were so confident was all that we were seeing. Nowhere in their whole analysis do these myth-imbibers deal with the sunspot-weather-causation 'heresy' currently trying to fight its way past the AlGore team on CO2..??
On top of their insolation-driven idea, if we are just considering most myth-imbiber's analysis of the non-blue lines, they do not see the humongous elephant in the summer data, BETWEEN CDD data and RAIN/CLOUDINESS... maybe b/c they're constantly focusing on the big bright insolating light in the sky so they don't see the rest of the deep space control and fail to recognize that cloud patterns have a diurnal pattern that changes the picture... think about this for a moment, now:
If the clouds were so uniformly *cooling* of the earth temp all year around including the summer then the cooling degree days should have DIPPED instead of rising PRECISELY WHEN RAIN/CLOUD-DAYS ROSE... right? under the 'insolation' theory, temp should go down implying CDD would be DOWN when rain/cloud-days are greater in number... BUT it's the OPPOSITE...
The sun's heat defeats the fogginess cloud formation during the day IN SUMMER HERE and then clouds regain their hold by night time and KEEP THE HEAT **IN** that would otherwise be stolen by the deep space void... clouds and rain are mostly evening in summer, but winter clouds rule daytime (to solar's near uselessness in winter here)
Isn't that exciting and it's TOTALLY OFF THE RADAR OF THE EXPERTS ON DECENT WEATHER PREDICTION as well as OFF THE RADAR OF THE ENVIRO AND SPACE WEATHER TYPES, though maybe not off the radar of Piers Corbyn who's been challenging and BEATING the high tech weather station programs and their bragging supporters in London... Corbyn does commercial weather prediction with his systems based on sunspots (see WeatherAction.com) and he outdoes the climate-warming-CO2-political-fiends in the accuracy of his predictions compared to theirs... to the point that the politico-religious fiends on the web with their personal attacks against him are extreme in their animosity...
Anyway, it's the blue line that is the evidence against the current frenzy over CO2 as the driver of climate... hope this excitement leads to more... maybe...
Wonderful BrasscheckTV recently previewed a video (The Great Global Warming Swindle) that was intended to destroy the AlGore(et al) idea that CO2 as generated by humans, or any other way, was driving the climate instability. The majority of the effort in the video's script was in showing the weakness in that religiously held idea of CO2 and climate warming were intimately intertwined. The data correlation was less than we have been led to believe and on the usually vociferous 'other side' of the argument, the opposition has been biased in their equally political ideology. Fortunately, a few in the meterology and astronomy type areas were nevertheless struggling in spite of both of them, with causation, and trying to ignore both political-religions.
Finally a pair of Israelis -- Prof Nair Shaveev, (cosmic radiation history) and Prof Yan Veitzer (cloud formation) -- did comparison of sunspot data and planet temperature data, finding over millions of years that when cosmic rays went up, temperature went down, mirror image, perfect correlation quality.. but of course, those time periods for their data points were massive time intervals, century size or more, not even close to decades, much less yearly.
So began the quest to understand the mechanism and to refine the time intervals to see if the relationship held in the closer time-view. Major work was done by the Danes -- their Meterology Institute and their Space Center -- to bring the picture into closer focus, though still planetary in their thinking. A few brave souls have picked up the banner and have attempted to make headway for their now-blossoming theory which is an amazing construct in itself.
The Theory
Sunspots are electromagnetic storms and send out a solar electromagnetic wind that reaches out into space, disturbing earth how? Well, the normal background cosmic radiation (from novi all over in space) interacting with water vapor over the seas, produces clouds which exert cooling to counteract the sun's direct heating. That's the place where sunspot impacts earth weather. Solar activity generates solar wind that deflects the cloud-forming cosmic radiation so that solar warmth reaches the earth and seas in abundance unlike under cloud cover of whatever depth....
At that point the video leaves any further progress undisclosed... Leaving the viewer to wonder about that finer focus, maybe down to daily? ...and what about down to that viewer's own weather, not some fictionally-constructed 'planetary' temperature. Your own temperature, this week or this month or even today?
The Miracle Trek
What I wanted was some idea of how close was the relationship between sunspot frequency and local weather, as we experience it, namely heating need, cooling need and precipitation.. would there be anything in our local data to confirm the idea that weather is just a figment of the sunspot influence on planetary atmosphere..? Would it show up in daily life, in daily weather, in our location?
Well I took a gamble, got the daily sunspot data for 2012 from the Belgian space group as well as the 250 year avg of sunspot peaks to use for judging normalcy of sunspots in daily data...
...and gathered tons of weather data from the nearby Lunken Airport's database of Cinci temperatures and rainfall... daily for the entire year 2012...
...calculated HDDs and CDDs (heating and cooling degree days)... then dug out the 30year avg monthly weather data as a normalizing base (a day that was 100% would then mean just normal average temp or normal average rain)...
---did the 30day rolling averages to get smooth data that would match the 30year avgs that were stored in monthly-type data so that the lagging-30day avg at each point would be normalizable by the calendar month avg, producing a rolling normalized 30 day data-point at each day as the daily data rolled along on the graph for sunspots... and that normalized 30day avg did stand then ready for comparison with the daily sunspot data.. maybe there'd be a lag or not or nothing show up at all.. or whatever...
Then we plotted it and were SHOCKED to see how completely it CONFIRMED that there's an undeniably, *astoundingly strong* relationship between sunspots, rainclouds and heat/cooling degree data.. 365 days of in-synch movement, see for yourself in the attachment of the glorious graph.. We about fell off our chairs...
[The blue is sunspot data, red is rain/cloud data, yellow is heating degree day data, and green is cooling degree data in amazing choreography ] In case the graph does not show well in your browser at this blog-page, I've posted it at CIGHE
CO2 is just a symptom... sunspots rule...
But wait, it's not just the in-synch-ness that is CO2-driver-myth-destroying...
The nighttime cloud deep space twist
Many in the myth-imbiber side will just wave that this insynch-ness is not surprising but in analysing their hand-waving ideas, it becomes clear that they were not digesting the idea that the blue line on the graphs is SUNSPOTS, NOT INSOLATION as was what they were so confident was all that we were seeing. Nowhere in their whole analysis do these myth-imbibers deal with the sunspot-weather-causation 'heresy' currently trying to fight its way past the AlGore team on CO2..??
On top of their insolation-driven idea, if we are just considering most myth-imbiber's analysis of the non-blue lines, they do not see the humongous elephant in the summer data, BETWEEN CDD data and RAIN/CLOUDINESS... maybe b/c they're constantly focusing on the big bright insolating light in the sky so they don't see the rest of the deep space control and fail to recognize that cloud patterns have a diurnal pattern that changes the picture... think about this for a moment, now:
If the clouds were so uniformly *cooling* of the earth temp all year around including the summer then the cooling degree days should have DIPPED instead of rising PRECISELY WHEN RAIN/CLOUD-DAYS ROSE... right? under the 'insolation' theory, temp should go down implying CDD would be DOWN when rain/cloud-days are greater in number... BUT it's the OPPOSITE...
The sun's heat defeats the fogginess cloud formation during the day IN SUMMER HERE and then clouds regain their hold by night time and KEEP THE HEAT **IN** that would otherwise be stolen by the deep space void... clouds and rain are mostly evening in summer, but winter clouds rule daytime (to solar's near uselessness in winter here)
Isn't that exciting and it's TOTALLY OFF THE RADAR OF THE EXPERTS ON DECENT WEATHER PREDICTION as well as OFF THE RADAR OF THE ENVIRO AND SPACE WEATHER TYPES, though maybe not off the radar of Piers Corbyn who's been challenging and BEATING the high tech weather station programs and their bragging supporters in London... Corbyn does commercial weather prediction with his systems based on sunspots (see WeatherAction.com) and he outdoes the climate-warming-CO2-political-fiends in the accuracy of his predictions compared to theirs... to the point that the politico-religious fiends on the web with their personal attacks against him are extreme in their animosity...
Anyway, it's the blue line that is the evidence against the current frenzy over CO2 as the driver of climate... hope this excitement leads to more... maybe...
Subscribe to:
Posts (Atom)